Aftershock: How rsETH/wstETH Liquidity and Price Moved in the Hours After April 18
A single transaction hits the rsETH/wstETH Uniswap v3 pool on Ethereum on April 18, 2026. It leaves a clear mark in the onchain data. That mark includes a 72.7% price impact. It includes a recovery within 108 seconds. It includes a gas signature that stands out across the entire session. This piece is tracing those ripple effects block by block. It is not narrating the event itself. It is showing what the pool data records before, during, and after.
Data source: Bitquery DEX Pool data: rsETH/wstETH Kelp DAO Liquidity Pool Events
Pool: rsETH/wstETH on Uniswap v3, Ethereum Mainnet
Pool contract: 0x7a27c7b7e2536e452c57d3e8b909d9ecba2e2eee
rsETH token: 0xa1290d69c65a6fe4df752f95823fae25cb99e5a7
wstETH token: 0x7f39c581f595b53c5cb19bd0b3f8da6c935e2ca0
The Pool in Normal Conditions
Before examining the event itself, consider what "normal" looks like for this pool.
The rsETH/wstETH Uniswap v3 pool is a narrow-spread pair. Both assets are ETH derivatives. rsETH is Kelp DAO's restaked ETH token. wstETH is Lido's wrapped staked ETH. In normal market conditions, the BtoAPrice (rsETH priced in wstETH) is holding steady at approximately 0.8641 wstETH per rsETH across every pool event in the dataset prior to the shift. This slight discount to parity is expected. rsETH carries additional restaking risk relative to wstETH. The market prices it marginally lower.
The pool holds roughly:
- 952.54 rsETH on the rsETH side
- 0.44 wstETH on the wstETH side
Total liquidity is approximately $1.9M at prevailing prices. This is a thin secondary market pool. It is not the primary liquidity venue for rsETH. It still matters as a price discovery signal.
The Dataset: Pool Events on April 18, 2026
The Bitquery query is pulling DEX Pool Events for this contract. It is returning block-by-block snapshots of pool state. Those snapshots are covering price, liquidity depth, gas, and transaction hash.
Here is the complete timeline from the data:
| Block | Time (UTC) | BtoA Price (rsETH → wstETH) | Gas Used |
|---|---|---|---|
| 24908723 | 19:03:59 | 1.1572 | 3,100,000 |
| 24908735 | 19:06:23 | 1.1572 | 752,766 |
| 24908894 | 19:38:11 | 1.1572 | 953,820 |
| 24908896 | 19:38:35 | 1.1572 | 603,465 |
| 24909014 | 20:02:11 | 1.1572 | 932,125 |
| 24909056 | 20:10:35 | 1.1572 | 3,131,096 |
| 24909082 | 20:15:47 | 4.2403 | 3,532,244 |
| 24909091 | 20:17:35 | 1.1572 | 1,304,494 |
| 24909092 | 20:17:47 | 1.1572 | 625,123 |
| 24909303 | 21:00:23 | 1.1572 | 854,674 |
BtoAPrice = how many rsETH units are required to receive 1 wstETH. Normal: ~1.157. During the shift: 4.24.
The Shift: Block 24909082
Everything in this dataset points to one block.
At 20:15:47 UTC, block 24909082, the BtoAPrice moves from its stable 1.157 to 4.240. That move implies rsETH's implied price against wstETH drops from 0.864 to 0.236. The move amounts to a 72.7% price impact in a single transaction.
The transaction hash is 0x079f4eef71761d0c6b48dd9619c938f597c3763fc70602ecbd7ae9c5eeadc002. Gas used is 3,532,244. That figure is the highest gas consumption in the entire dataset by a wide margin.
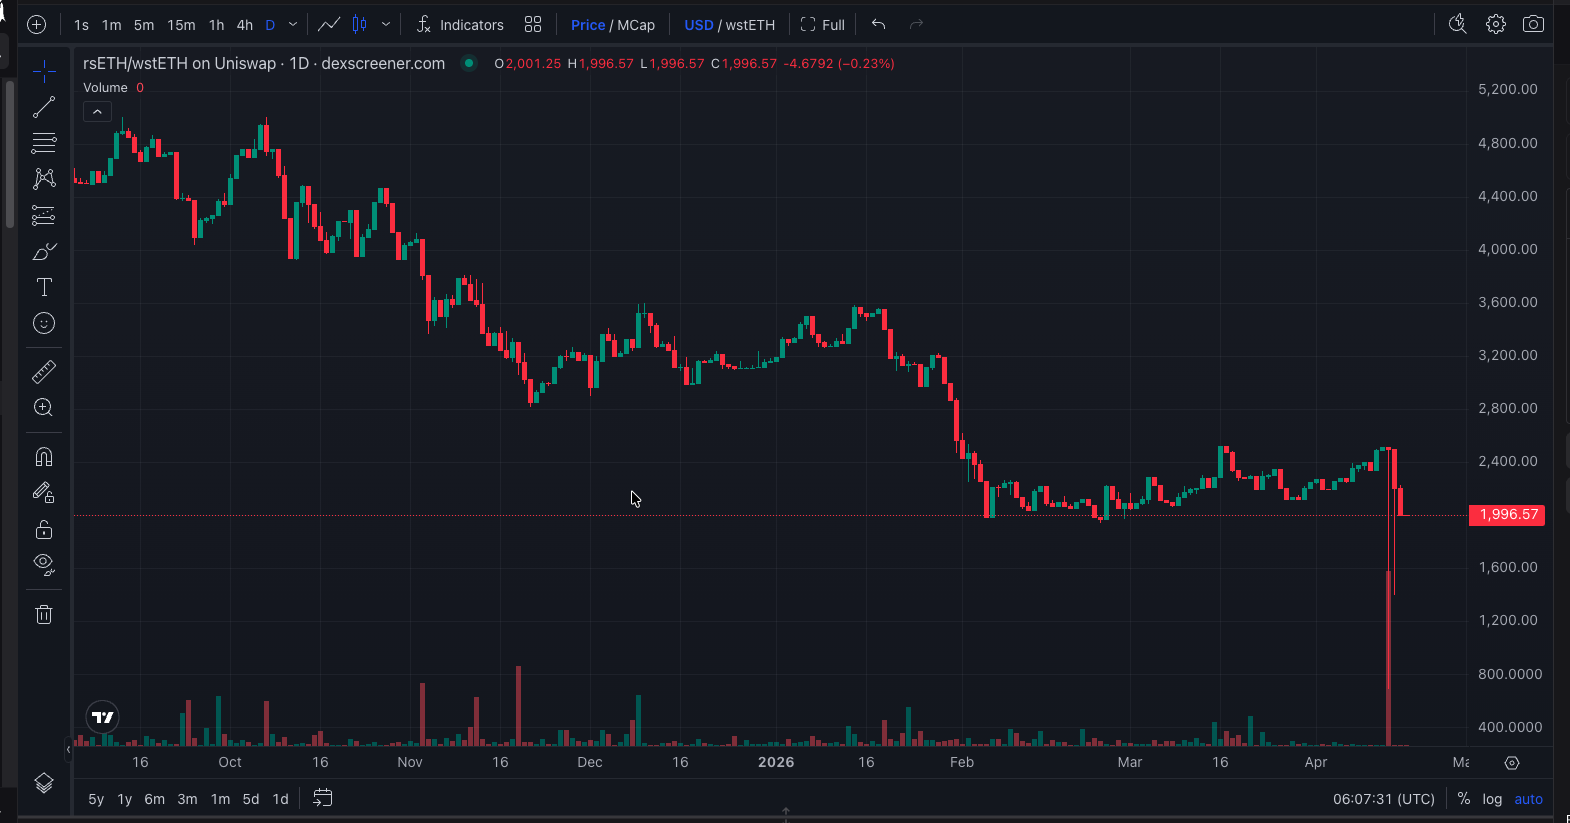 rsETH/wstETH 1D price chart on DEX Screener. The vertical wick on the far right corresponds to block 24909082 at 20:15:47 UTC. Source: dexscreener.com/ethereum/0x7a27c7b7e2536e452c57d3e8b909d9ecba2e2eee
Why a Thin Pool Amplifies Price Impact
The 72.7% move is striking. Pool depth explains it mechanically.
Uniswap v3 is concentrating liquidity in specified price ranges. Only ~952 rsETH and ~0.44 wstETH are sitting in the active tick range. A sufficiently large directional swap can exhaust all available liquidity on one side. It can push the price through multiple tick boundaries in a single transaction. The AMM's constant product invariant (x · y = k) implies that as one asset depletes, its price is rising non-linearly. In a deep pool, this effect is gradual. In a $1.9M pool, a large swap can move price by orders of magnitude if it crosses all active ticks.
This pattern captures the core tension in AMM design. Concentrated liquidity improves capital efficiency under normal conditions. It also concentrates the impact of extreme transactions. A pool with $200M in liquidity would absorb the same swap with a fraction of the price movement.
The Recovery: 108 Seconds
At block 24909091 (20:17:35 UTC), 108 seconds after the shift, the BtoAPrice returns to 1.157. The correcting transaction uses 1,304,494 gas. That level is consistent with a complex multi-step arbitrage or liquidity rebalancing operation.
The recovery dynamic is structurally typical. When a large swap is distorting price away from other market venues, arbitrage bots are detecting the divergence. They are correcting it immediately. In this case, if rsETH is still trading at parity elsewhere (or close to it), the Uniswap pool price at 0.236 is representing a significant arbitrage opportunity. That opportunity is lasting for exactly 2 Ethereum blocks.
The important number is not the 72.7% drop. It is the 108 seconds.
Gas as a Forensic Signal
Examining gas consumption across the dataset reveals a pattern worth noting.
Gas usage for standard pool interactions in this dataset ranges from approximately 600K to 950K. Three transactions stand out:
- Block 24908723 (19:03:59): 3,100,000 gas, 5 hours 12 minutes before the shift
- Block 24909056 (20:10:35): 3,131,096 gas, 5 minutes before the shift
- Block 24909082 (20:15:47): 3,532,244 gas, the shift itself
High gas transactions in Ethereum typically indicate complex multi-contract interactions. Those interactions include multiple external calls, state changes across several contracts, or operations involving large data payloads. The clustering of high-gas transactions in the 19:03 to 20:15 window is observable in the data. Naming the exact contract interactions requires tracing each transaction through the EVM call stack. That work sits beyond the scope of this pool-level analysis.
What the Pool Data Does and Doesn't Tell Us
The DEXPoolEvents query is capturing pool-level state changes. Each event is recording price, liquidity depth, and the transaction that triggers each state change. It is not capturing several other layers.
It does not capture the internal call stack of each transaction (which contracts were called, in what order). It does not capture whether the swap was initiated by an EOA or a contract. It does not capture price feeds and oracle updates on other protocols during the same window. It does not capture net capital flows into or out of lending markets holding rsETH as collateral.
The pool data is a narrow but precise instrument. It states exactly when this particular Uniswap v3 pool reprices rsETH. It states how large the price impact was. It states how long it lasted. It does not explain what caused the transaction. It does not trace funds beyond this pool.
Reading AMM Stress Events From Onchain Data
The rsETH/wstETH pool event on April 18 exemplifies a pattern that appears in AMM data during periods of unusual market activity. A single high-gas transaction produces a price impact far larger than the pool's normal trading range. Rapid mean-reversion follows as arbitrage corrects the imbalance.
The analytical questions this kind of data opens up include the following.
Oracle lag: If this pool reprices rsETH at 20:15:47, when does Chainlink's rsETH oracle (used by lending protocols as a price reference) reflect the same price? The delta between DEX repricing and oracle update is measurable onchain. That delta determines the window during which any protocol using a stale rsETH price feed was exposed to mispriced collateral.
Contagion velocity: rsETH was whitelisted as collateral on Aave at the time of this event. Compare the speed at which rsETH's pool price moves (one block, 12 seconds) with the speed at which oracle-dependent protocols update (typically minutes to hours, depending on deviation thresholds). That gap can be quantified block-by-block.
Thin pool signal value: A $1.9M pool is not where large capital flows through. It may be where price discovery happens first. Thin liquidity means large transactions produce immediate, visible price signals. Whether thin DEX pools lead or lag primary liquidity venues during stress events is an open empirical question. Onchain data can answer it.
Related research: Why Large Trades Fail on DEX — institutional-scale slippage data across WETH, WBTC, and stablecoin pairs. Fading Toxic Flow: DEX Liquidity Shock Mean-Reversion — a strategy that systematically fades isolated price impacts like the one recorded here. MEV Boost Relay Trade Profit Monitor — tracking builder revenue from private mempool trades during stress events. Hedgey Finance Exploit: Six Months Later — a previous DeFi exploit post-mortem using the same onchain forensics methodology.
Data sourced from Bitquery. Pool price chart from DEX Screener. All onchain data is public and verifiable on Etherscan.